𝐖𝐡𝐲 𝐐𝟒 𝐢𝐬 𝐚 𝐛𝐞𝐭𝐭𝐞𝐫 𝐭𝐢𝐦𝐞 𝐭𝐨 𝐢𝐧𝐯𝐞𝐬𝐭 𝐢𝐧 𝐞𝐪𝐮𝐢𝐭𝐢𝐞𝐬? 💹 🧐
A thread🧵
• The index drifted southward post US Fed rate hike coupled with depreciation in Rupee to all time low. The global anxiety that we are seeing lately would settle down soon.
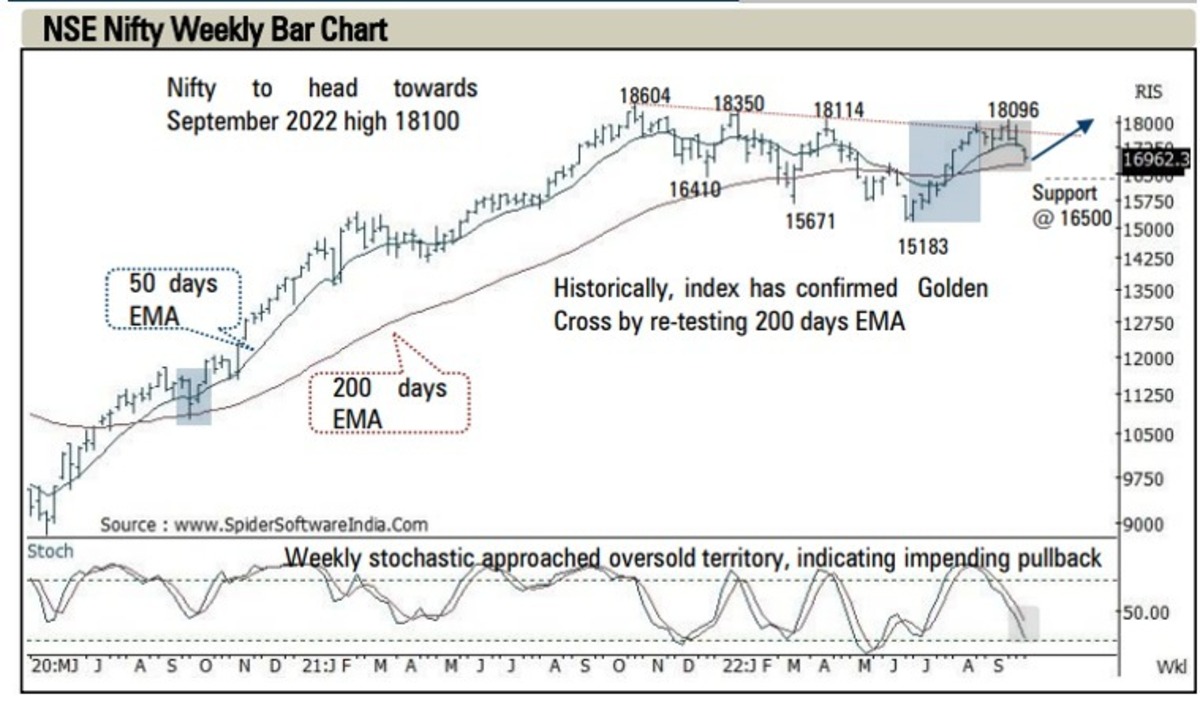
• This gradual pullback to 200 days EMA combined with slower retracement is considered a healthy bull market correction. Therefore, investors should not be construed ongoing correction as negative, rather use extended correction as an incremental buying opportunity as key support exists around 16500.
• Nifty registered a bullish golden crossover in August (50-DEMA crossing above 200-DEMA) implying major shift of momentum in favour of the bulls from a medium-term perspective.
For perspective: In last decade, in five out of 8 successful events, the Nifty has confirmed golden cross by bouncing from 200 days EMA. In current scenario, we can expect index to maintain same rhythm as it hovers around 200 EMA.
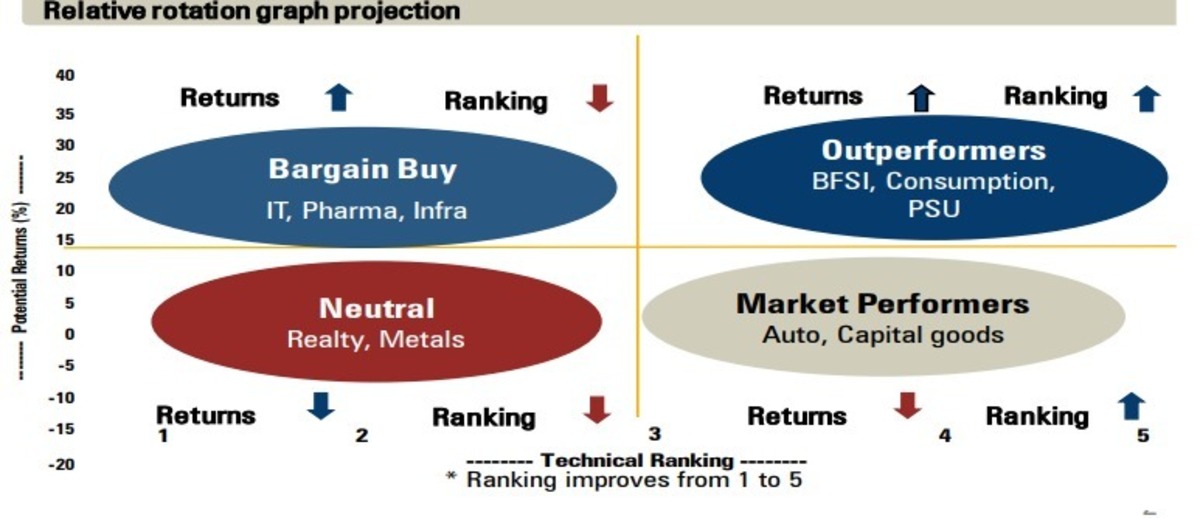
Swipe to refer our Sectorwise ranking👉
1/n
A thread🧵
• The index drifted southward post US Fed rate hike coupled with depreciation in Rupee to all time low. The global anxiety that we are seeing lately would settle down soon.
• This gradual pullback to 200 days EMA combined with slower retracement is considered a healthy bull market correction. Therefore, investors should not be construed ongoing correction as negative, rather use extended correction as an incremental buying opportunity as key support exists around 16500.
• Nifty registered a bullish golden crossover in August (50-DEMA crossing above 200-DEMA) implying major shift of momentum in favour of the bulls from a medium-term perspective.
For perspective: In last decade, in five out of 8 successful events, the Nifty has confirmed golden cross by bouncing from 200 days EMA. In current scenario, we can expect index to maintain same rhythm as it hovers around 200 EMA.
Swipe to refer our Sectorwise ranking👉
1/n